Burn ups - a follow up
In a follow up to my previous post on burn up charts, I sent an email this is adapted from to members of the team. In it I expanded on the use of Burn up charts in tracking progress on multiple release projects. All names have been changed to protect the innocent.
First burn up chart for Project X Vers 1.0.
Interesting information we can glean from this very early chart;
- We can say, with what we know so far, the likely release dates is sometime between Sprint 7 and Sprint 16.
- To increase the accuracy of our forecast release date, we need to spend more time doing workshops to breakdown the epics. This will reduce the gap between “Known scope and “Known worst case”
- More workshops to determine scope means less time to do actual work. (Catch 22)
- This range is due to large number of Epics (proportionally) still to be broken down to stories (8)
- 9 stories delivered is based on Tablet stories so far completed in this sprint of which most were carry overs from last sprint
Unknowns
There are still an unknown number of epics to be added to the backlog. As we get feedback from clients as well as a result of workshops on the Epics we already have in our backlog.
Support tasks adding to backlog
We have 2 Beta clients already and are seeing the impact of “support” tasks already. Onboarding Client A and Client B have added about 3 days worth of team effort so far, with tasks such as configuration, Software installs and the like. We would expect support tasks to increase as people start using the product in anger.
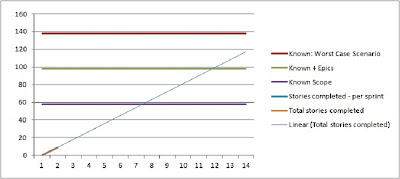
Chart 1: Countdown to commercial launch
Interesting nerdy stuff
In the chart (Countdown to commercial launch)The lines between “Known: worst case”, “ Known + epics” and “Known Scope” run parallel at the moment. This reflects the degree of unknowns buried within the Epics. As we get deeper into the project, these lines ‘should’ start to converge as we do more workshops to break the epics down.
In the burn down chart (countdown to Beta) shown below (from Beta) we can see that ‘actually’ happened, This trend was less obvious as we only started tracking progress once I joined the team around sprint 6-7 (from memory).
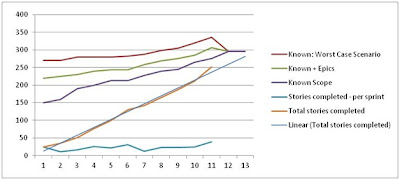
Chart 2: Countdown to Beta
That’s it from me.


Comments
Post a Comment